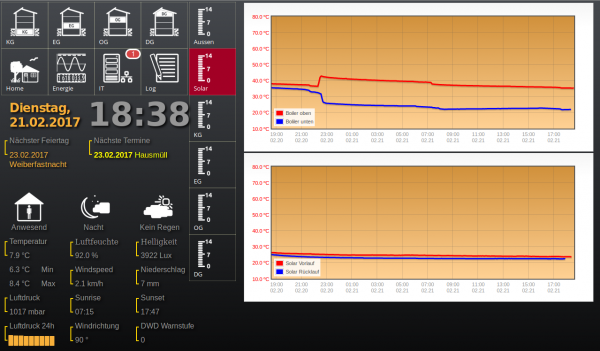
using google charts / data is only locally stored / chart is updated every minute/
-
Share your GUI
-
I like your setting.
could you probably write a small HowTo for newbies")
-
@jan-san Dear Jan-San,
How you get Google Charts / Gauge working? I’m not so familiar how to load and connect.
MfG
Hein Mueck
-
Hi, I wrote a short python script, which reads phpsysinfos api from my VPS, this is what it looks like:

if there is demand, I would share this
-
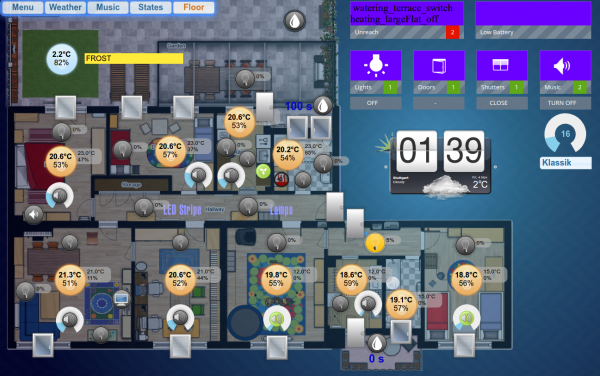
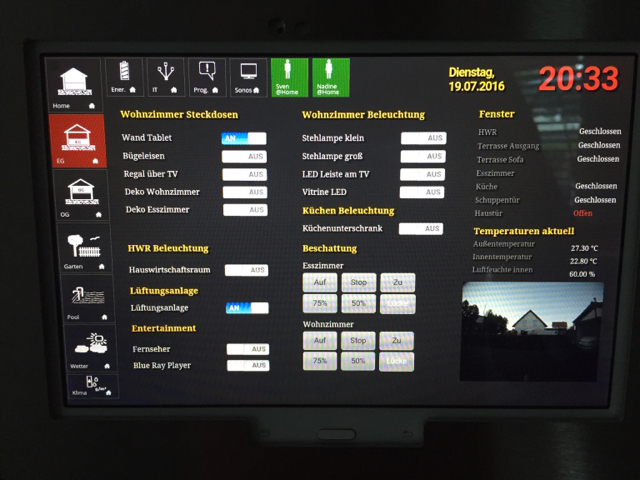
Hi All
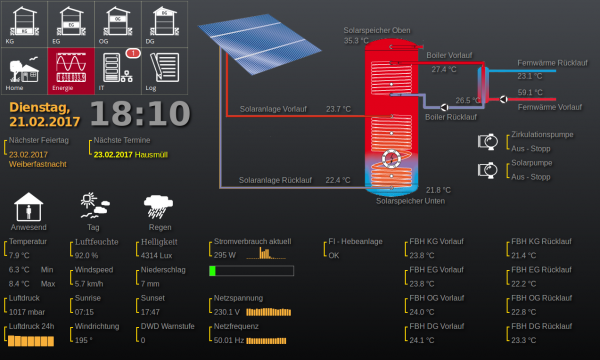
here is my GUI
all Data is from pimatic.
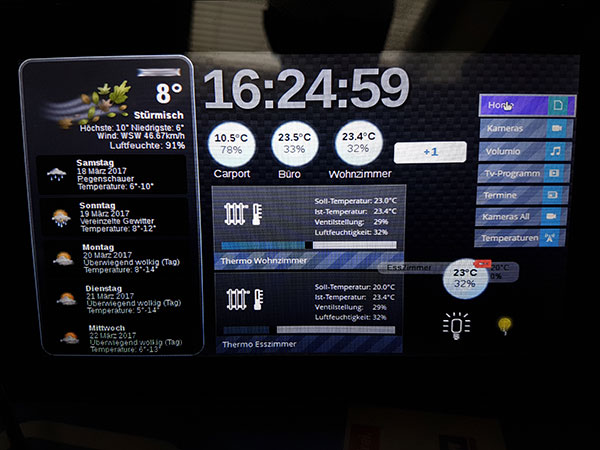
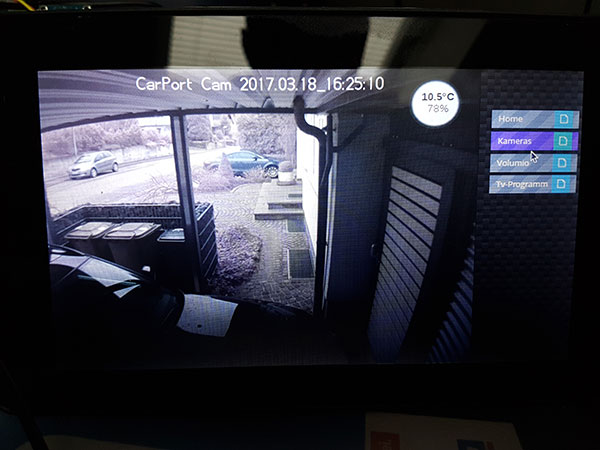
Bluefox from iobroker Projekt built a Pimatic Connector.So i can use both systems with a very nice Visualisation.
Running on a Pi3 with official 7" touchscreen in ChroniumBrowser Kiosk Mode. -
@nsession WOW! that’s so great!!
pimatic v0.9 has been released!
Support Pimatic and get some free stickers
Like us on Facebookmake it so !
-
@nsession Very nice. How much time did you spent on setting up the UI with iobroker.vis and which other “vis” extensions did you use? Is it difficult to get started? I think this is great stuff which may also be interstesting for other users.
"It always takes longer than you expect, even when you take into account Hofstadter's Law.", Hofstadter's Law
-
@mwittig It must be rather easy. Here you can find a couple of videos, that explain how to do that.
https://www.youtube.com/watch?v=cTEb-U9G5yw (german)
https://www.youtube.com/watch?v=nCjFuV5oR_Q&t=59s (any language) -
It is very easy and i spend 2-3 hours to build this gui.
It is just in experimentation.
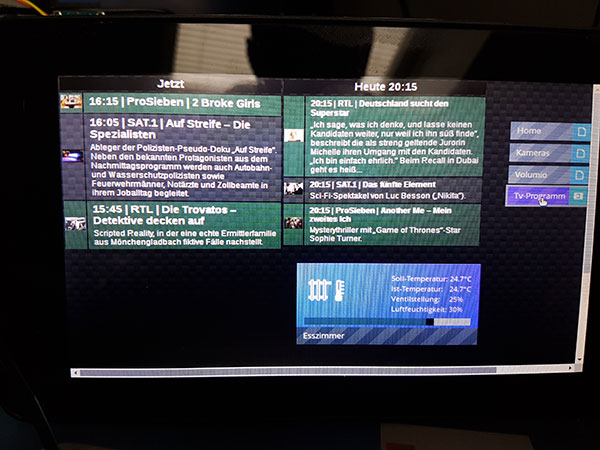
The power of iobroker is great. I use my existing Pimatic with all Devices an iobroker for Visualisation and some extra stuff like TV-Programm. Combining both Systems i sgreat and many thanks to Bluefox for building an adapter for pimatic.Take a look to iobroker_dot_net
-
@Bluefox and @nsession Thanks for your feedback. I’ll definately give it a try. It’ll be great to have a short How-To article on this as part of https://forum.pimatic.org/category/22/howto. I think the video tutorials provide an excellent starting point.
"It always takes longer than you expect, even when you take into account Hofstadter's Law.", Hofstadter's Law
-
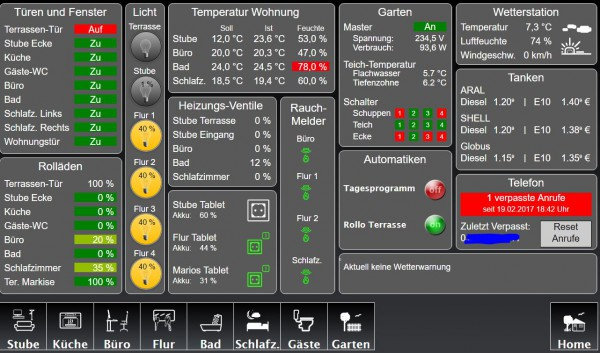
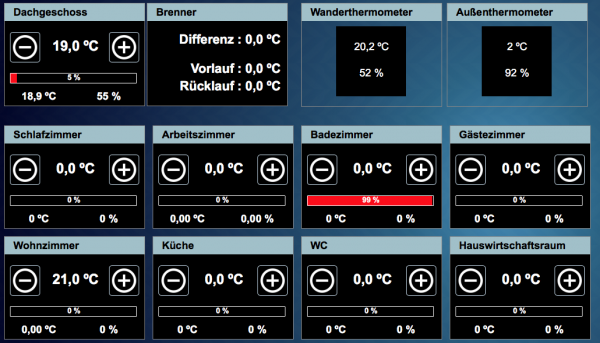
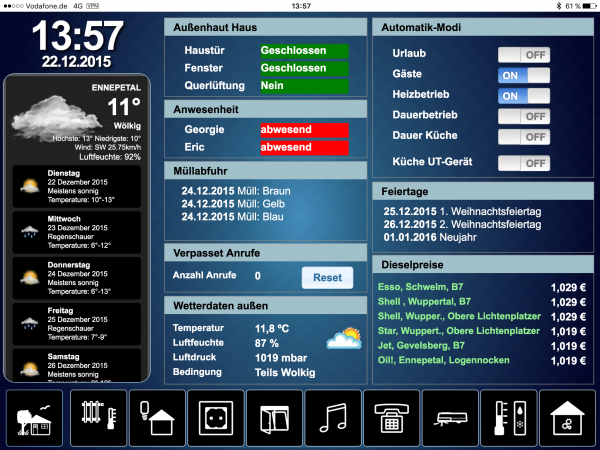
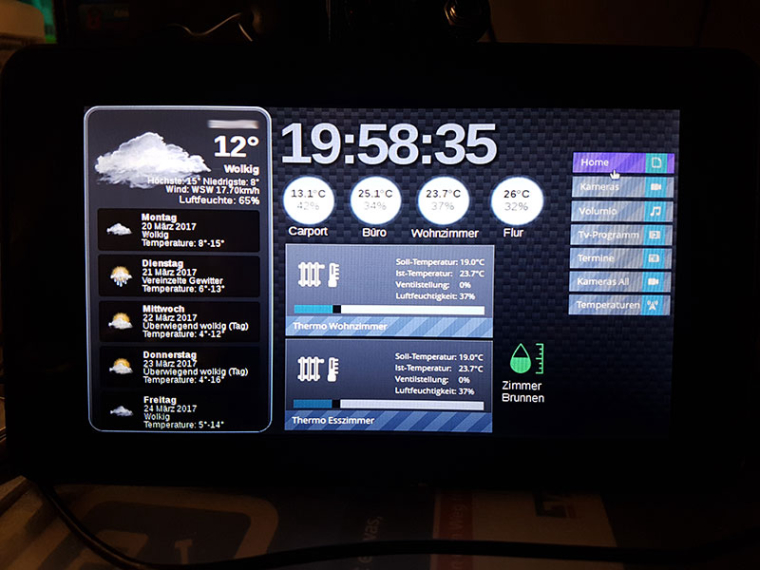
Here more examples of visualisation with vis:

-
time to get serious with iobroker …
@bluefox thx for your efforts on developing this iobroker addon for pimatic!pimatic v0.9 has been released!
Support Pimatic and get some free stickers
Like us on Facebookmake it so !
-
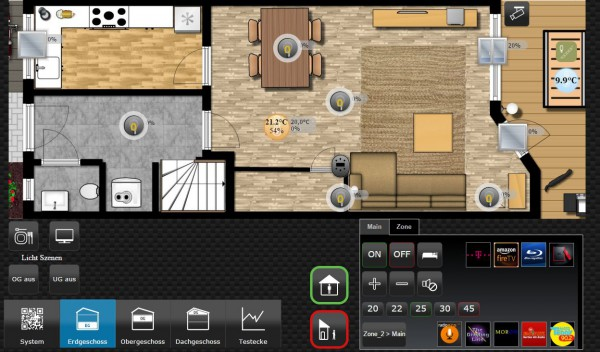
Hello leader21,
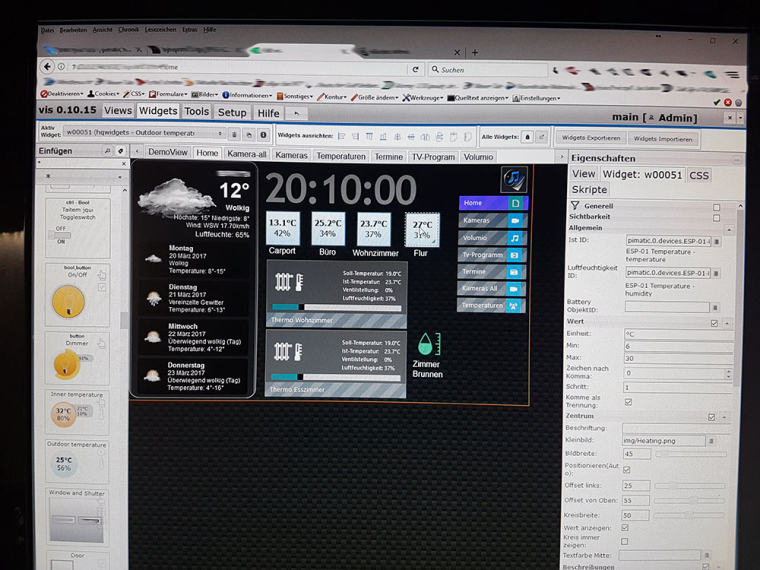
here 3 Screens to see how it works.
Screen 1: Visualisation on 7" Raspberry Touch Display.
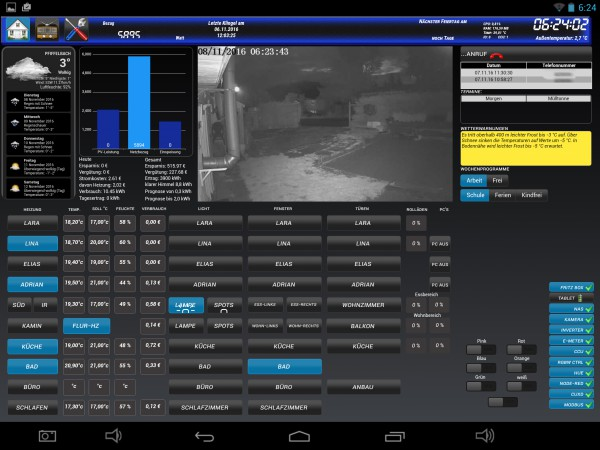
Screen : All Values in iobroker Admin with Pimatic-adapter:
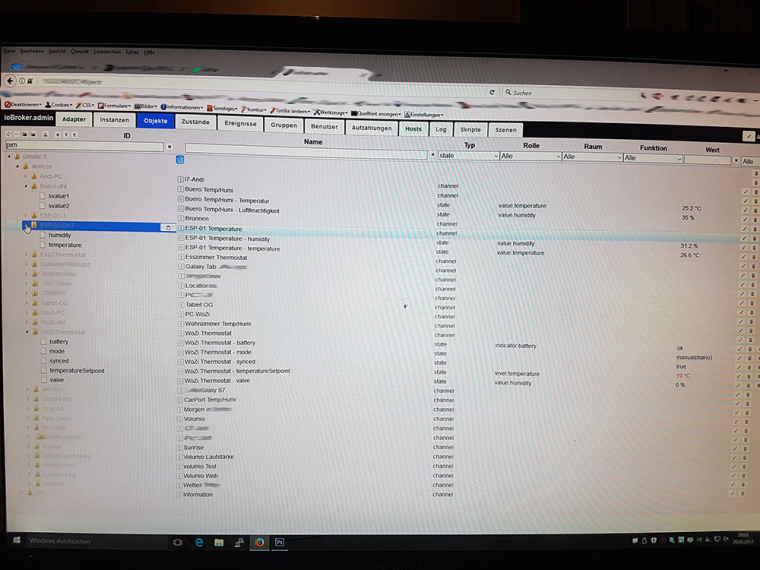
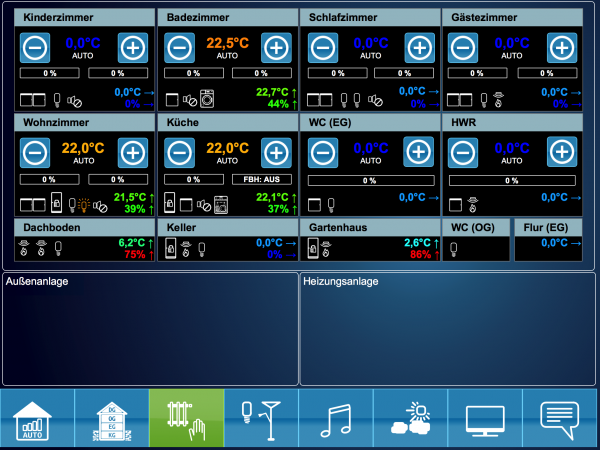
Screen 3: Visualisation Editor Drag and Drop:
-
Made a nest clone thingy to control a thermostat setpoint with websockets
")
Like my projects and help? Consider donating electroneum etnjwAKGPqF6omQWRmpp9u2BPyVDG9VuyRQjNJ1S8yfBdfR9qeUQ46kRy8KS2CNqbpNLRrsgmNW6F2TMzxmZgPrh6KctrkrYbm
-
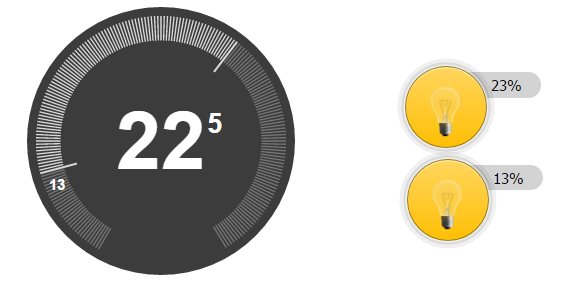
Another example how to create NEST like widget in 6 minutes.
https://youtu.be/bHpL3Q77hbM
-
@koffienl ok this is cool, simple question can we get this source code or something

-
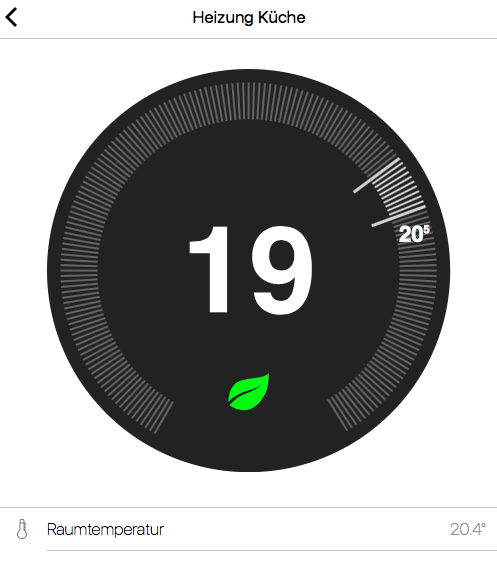
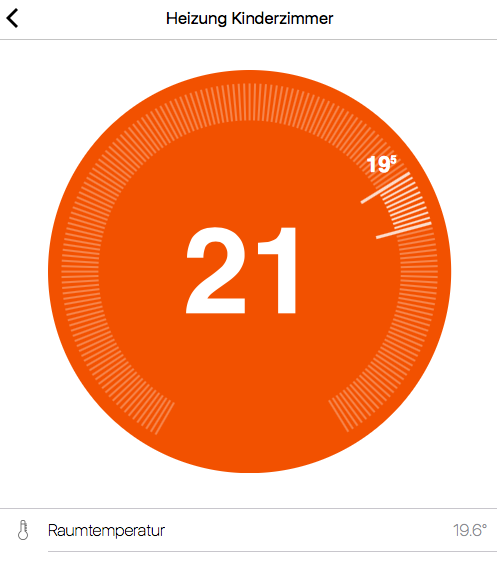
I developed a prototype iOS app, though i don’t have a developer account, so I had to refresh my build every 7ish days. I used the same thermostat and modified it to an app-like feeling.
That’s the dashboard the app - heating only. Two rooms, “Küche” (kitchen) got 2 thermostats but it looks like one. Additionally there is a temperature sensor that is display in the circle. If a setpoint is set the circle color changes to orange.
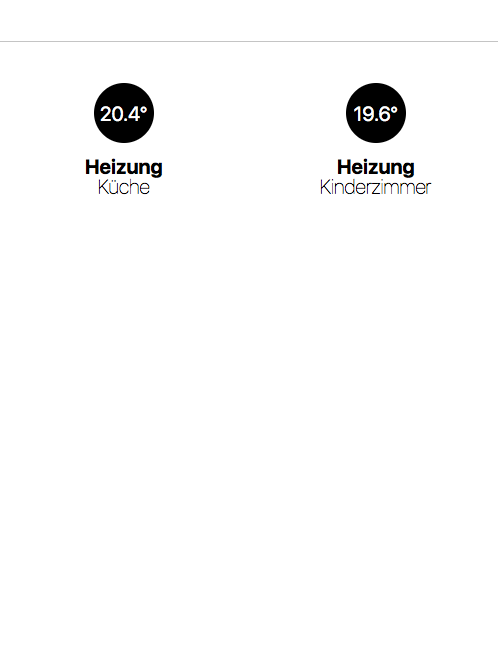
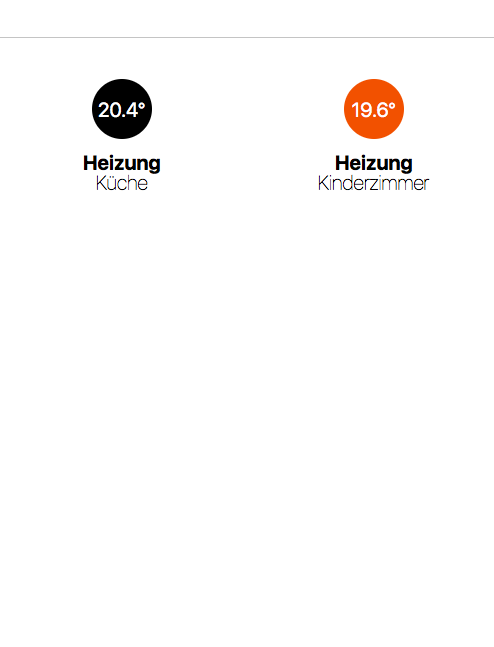
The single devices know two 2 states in general:
- eco (see green leaf): temperature is above set point, no further heating needed
- heating (see orange background): heaters will heat until setpoint is reached
-
Tweaked some stuff on the ‘nest’,
Now it will show you the difference between setpoint and room temperature.
When it’s colder than the setpoint, the little lines between the 2 temperatures are green (tol cold). When it’s warmer than the desired temperature the lines will be red (to hot)

Hope to publish something in git today
Like my projects and help? Consider donating electroneum etnjwAKGPqF6omQWRmpp9u2BPyVDG9VuyRQjNJ1S8yfBdfR9qeUQ46kRy8KS2CNqbpNLRrsgmNW6F2TMzxmZgPrh6KctrkrYbm
-
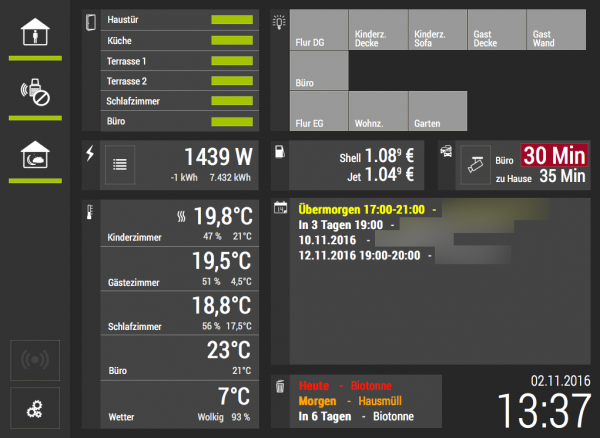
This is my GUI.
Made in Javascript/HTML/CSS and with the pimatic API.
And used the some styles of sweebee.