The Netatmo looks good, bit expensive though. On the other hand, good quality (and good looking) CO2 sensors aren’t cheap.
Volumio uses MPD (it’s basically just a web GUI for MPD) so integrating it is easy (already have it in my own setup).
-
Share your GUI
-
Like it ?

-
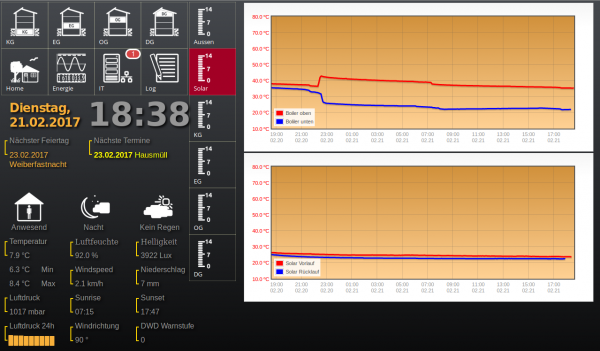
using google charts / data is only locally stored / chart is updated every minute/
-
I like your setting.
could you probably write a small HowTo for newbies")
-
@jan-san Dear Jan-San,
How you get Google Charts / Gauge working? I’m not so familiar how to load and connect.
MfG
Hein Mueck
-
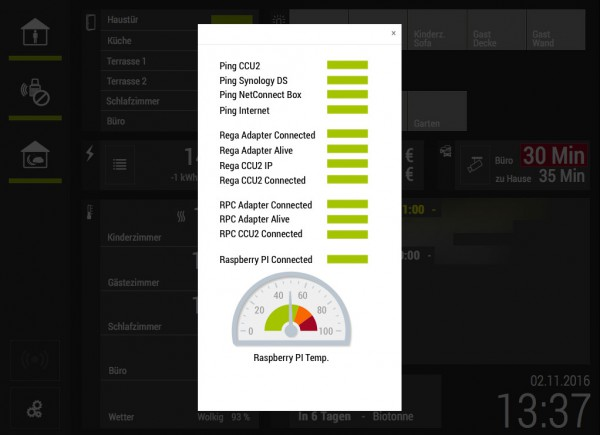
Hi, I wrote a short python script, which reads phpsysinfos api from my VPS, this is what it looks like:

if there is demand, I would share this
-
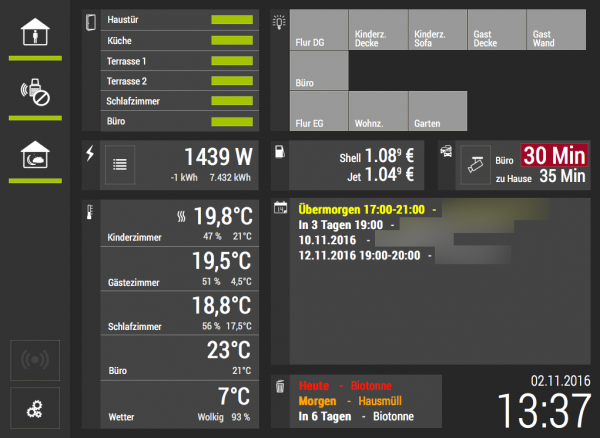
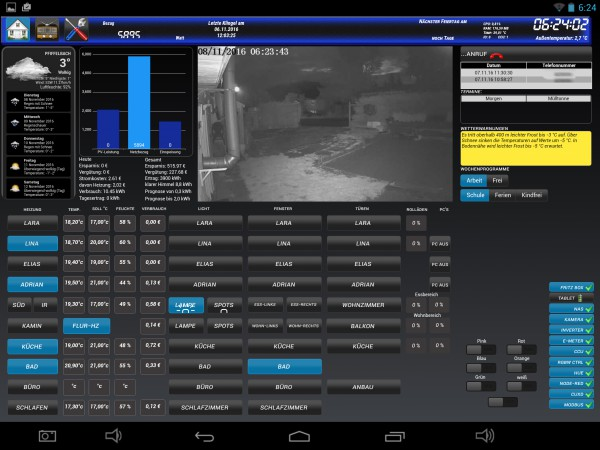
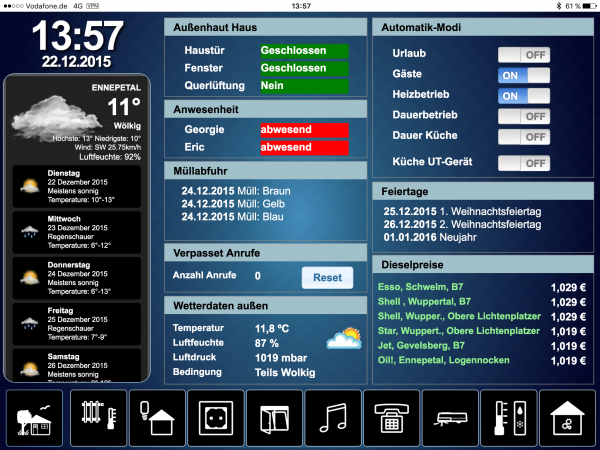
Hi All
here is my GUI
all Data is from pimatic.
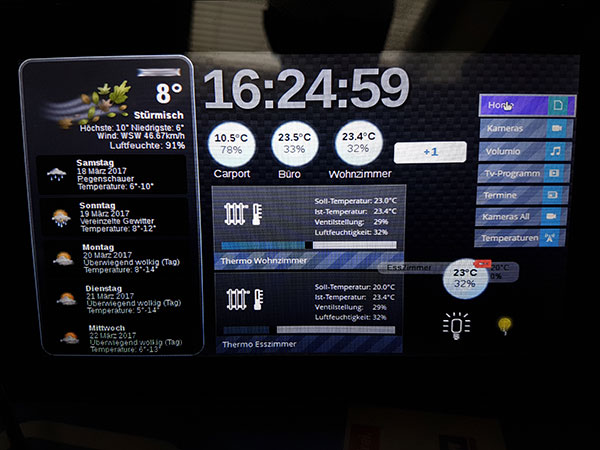
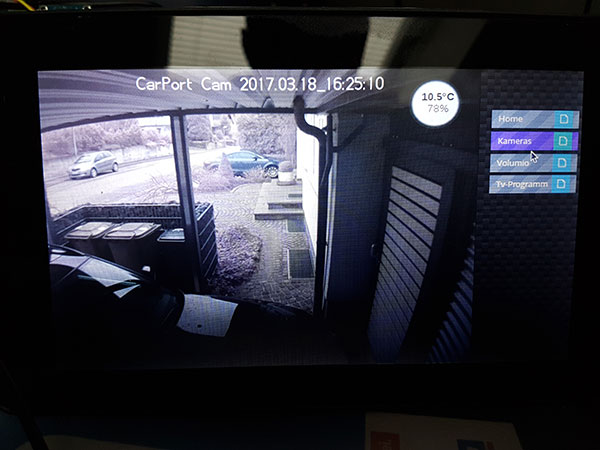
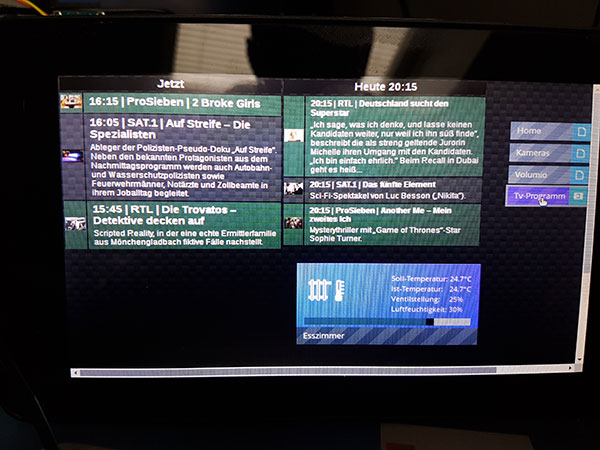
Bluefox from iobroker Projekt built a Pimatic Connector.So i can use both systems with a very nice Visualisation.
Running on a Pi3 with official 7" touchscreen in ChroniumBrowser Kiosk Mode. -
@nsession WOW! that’s so great!!
pimatic v0.9 has been released!
Support Pimatic and get some free stickers
Like us on Facebookmake it so !
-
@nsession Very nice. How much time did you spent on setting up the UI with iobroker.vis and which other “vis” extensions did you use? Is it difficult to get started? I think this is great stuff which may also be interstesting for other users.
"It always takes longer than you expect, even when you take into account Hofstadter's Law.", Hofstadter's Law
-
@mwittig It must be rather easy. Here you can find a couple of videos, that explain how to do that.
https://www.youtube.com/watch?v=cTEb-U9G5yw (german)
https://www.youtube.com/watch?v=nCjFuV5oR_Q&t=59s (any language) -
It is very easy and i spend 2-3 hours to build this gui.
It is just in experimentation.
The power of iobroker is great. I use my existing Pimatic with all Devices an iobroker for Visualisation and some extra stuff like TV-Programm. Combining both Systems i sgreat and many thanks to Bluefox for building an adapter for pimatic.Take a look to iobroker_dot_net
-
@Bluefox and @nsession Thanks for your feedback. I’ll definately give it a try. It’ll be great to have a short How-To article on this as part of https://forum.pimatic.org/category/22/howto. I think the video tutorials provide an excellent starting point.
"It always takes longer than you expect, even when you take into account Hofstadter's Law.", Hofstadter's Law
-
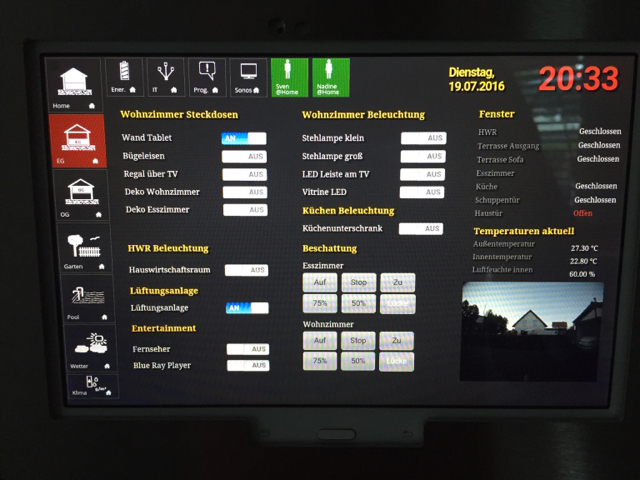
Here more examples of visualisation with vis:

-
time to get serious with iobroker …
@bluefox thx for your efforts on developing this iobroker addon for pimatic!pimatic v0.9 has been released!
Support Pimatic and get some free stickers
Like us on Facebookmake it so !
-
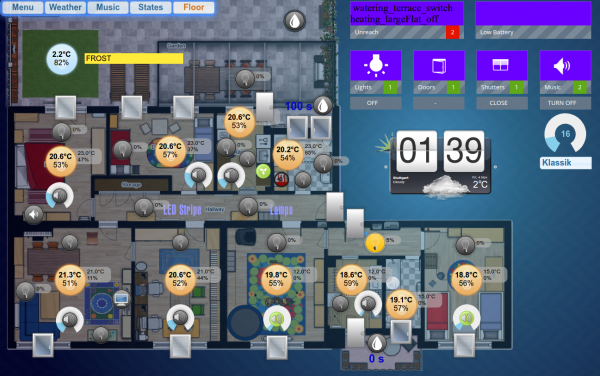
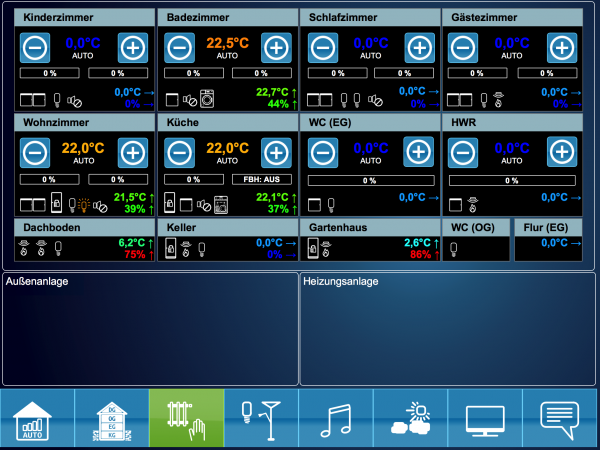
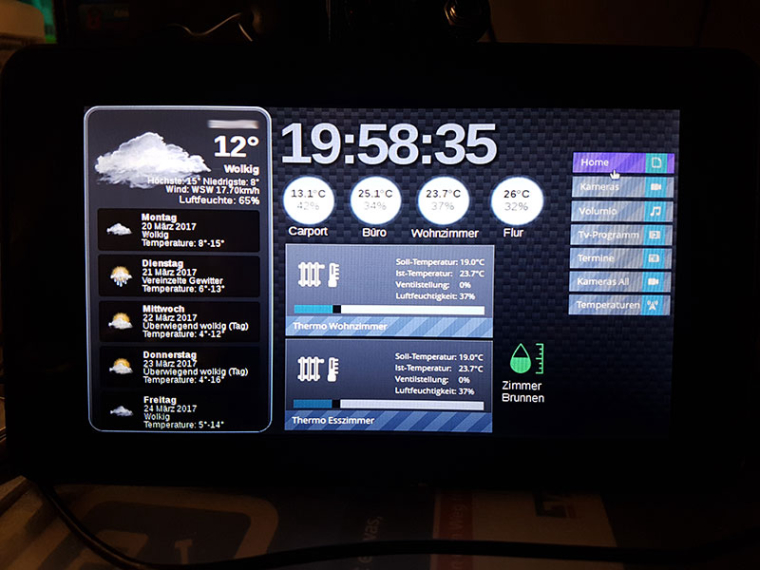
Hello leader21,
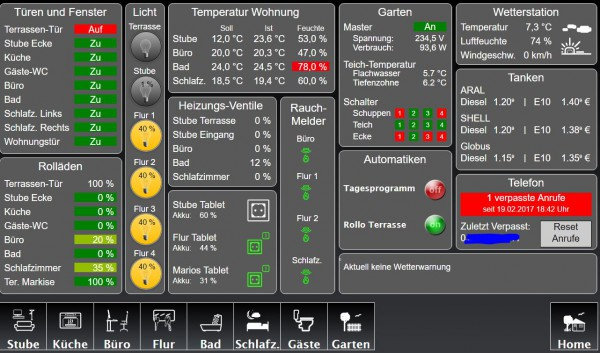
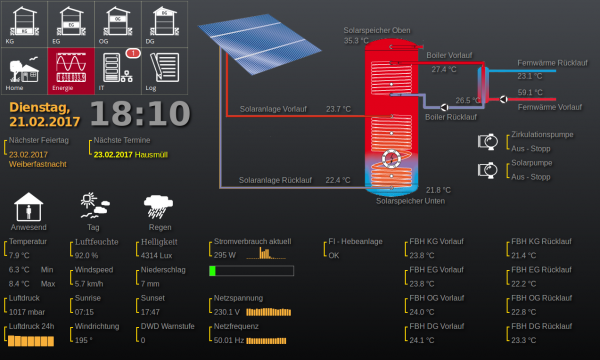
here 3 Screens to see how it works.
Screen 1: Visualisation on 7" Raspberry Touch Display.
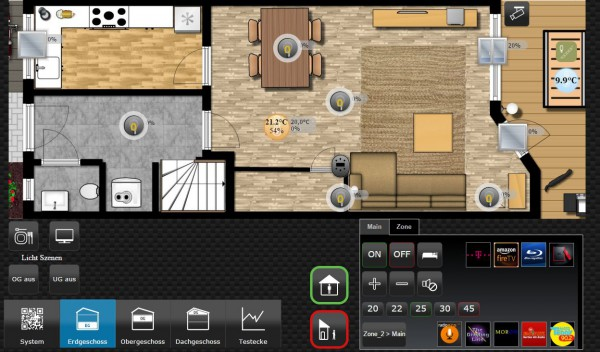
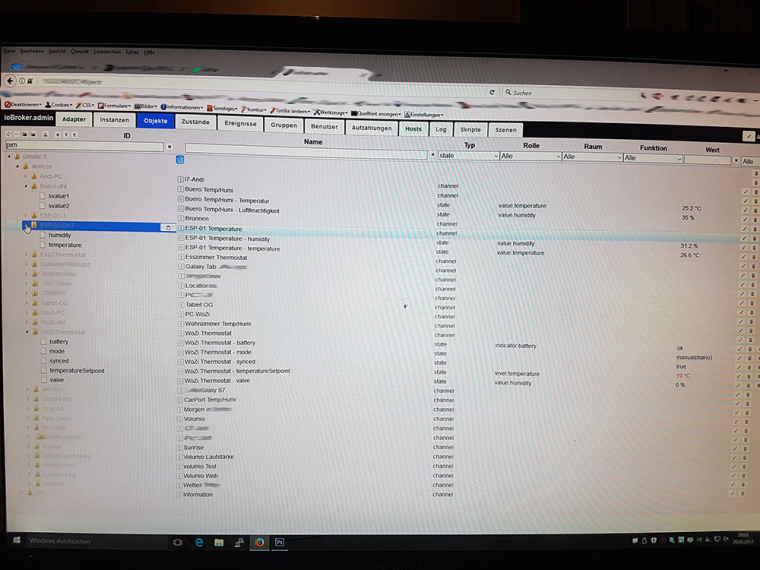
Screen : All Values in iobroker Admin with Pimatic-adapter:
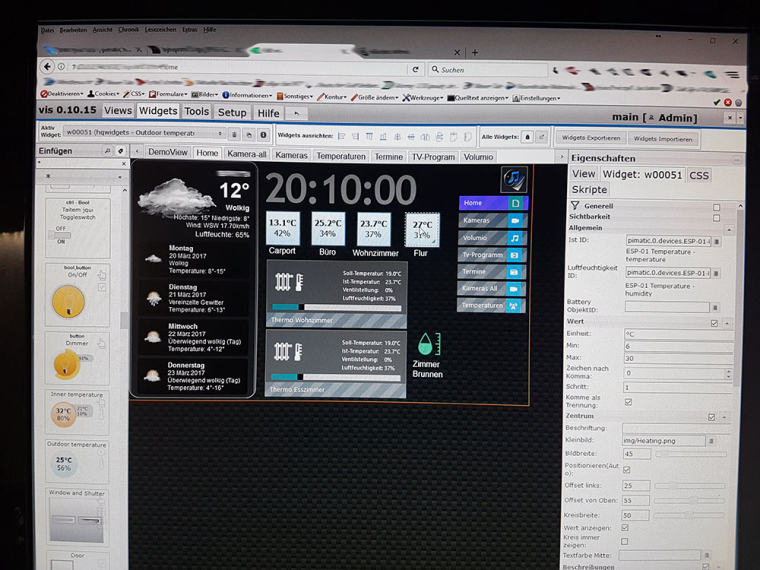
Screen 3: Visualisation Editor Drag and Drop:
-
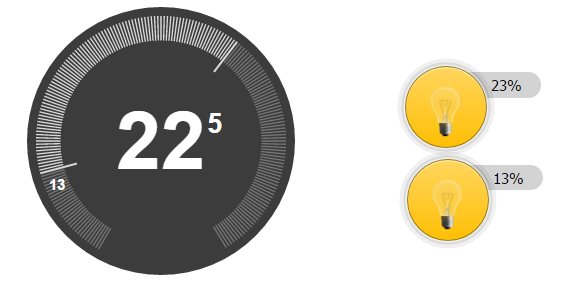
Made a nest clone thingy to control a thermostat setpoint with websockets
")
Like my projects and help? Consider donating electroneum etnjwAKGPqF6omQWRmpp9u2BPyVDG9VuyRQjNJ1S8yfBdfR9qeUQ46kRy8KS2CNqbpNLRrsgmNW6F2TMzxmZgPrh6KctrkrYbm
-
Another example how to create NEST like widget in 6 minutes.
https://youtu.be/bHpL3Q77hbM
-
@koffienl ok this is cool, simple question can we get this source code or something

-
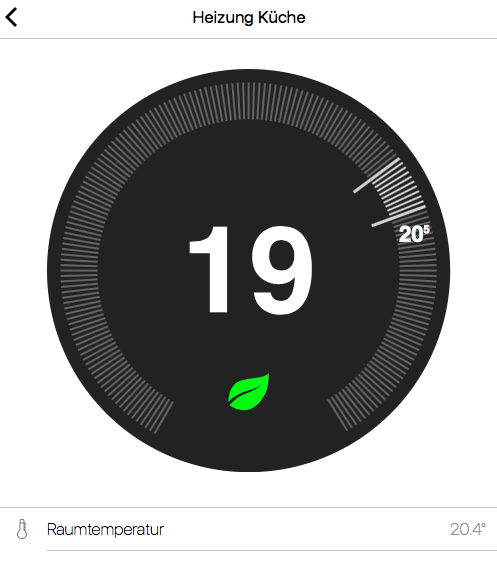
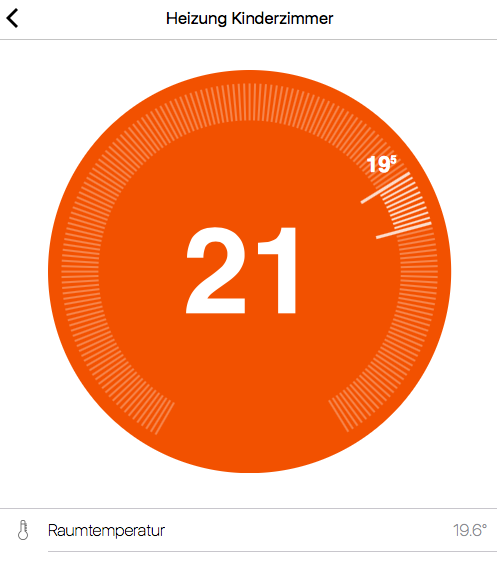
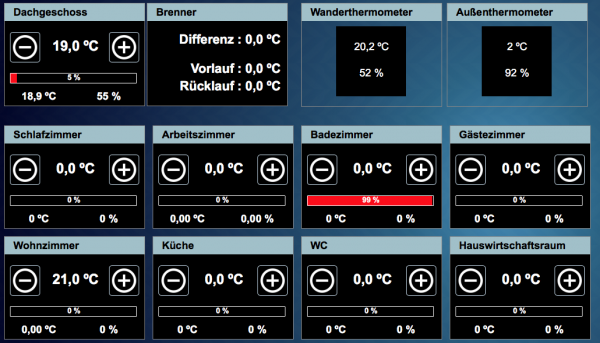
I developed a prototype iOS app, though i don’t have a developer account, so I had to refresh my build every 7ish days. I used the same thermostat and modified it to an app-like feeling.
That’s the dashboard the app - heating only. Two rooms, “Küche” (kitchen) got 2 thermostats but it looks like one. Additionally there is a temperature sensor that is display in the circle. If a setpoint is set the circle color changes to orange.
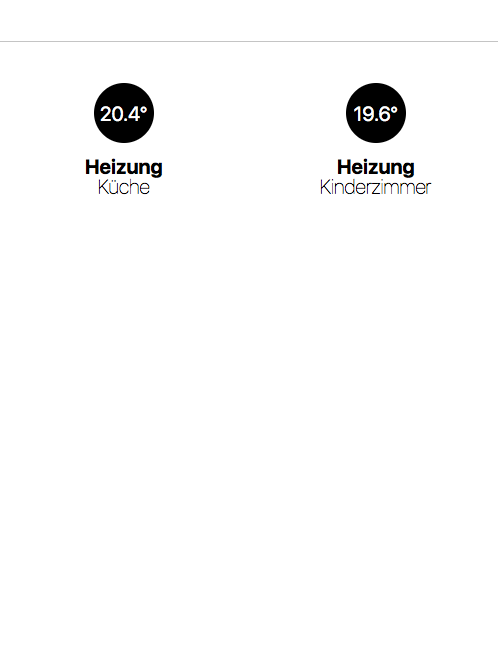
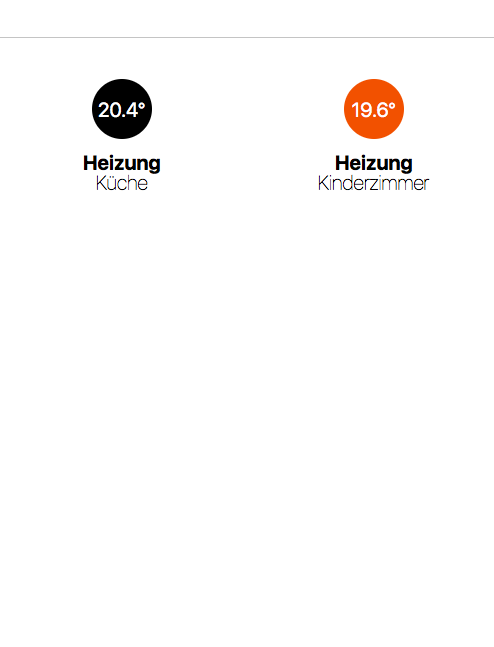
The single devices know two 2 states in general:
- eco (see green leaf): temperature is above set point, no further heating needed
- heating (see orange background): heaters will heat until setpoint is reached