@schmucke
You can display such statistics using variables.
I implemented it this way:
You can adapt this to your counter varable instead of $powermetercounter.
In your case the current consumption can also be calculated via a variable
and display the delta each minute for example. (it depends on how often a pulse is generated)
Variables:
$daycounter
$yesterdaycounter
$weekcounter
$powermetercounter <- your m³ var
$currentcounter
Rules:
when its 0:00 then $yesterdaycounter = $powermetercounter - $daycounter and after 1 second
$daycounter = $powermetercounter
when its 0:00 and monday then $weekcounter = $powermetercounter
when every 1 minute then $currentcounter = $powermetercounter
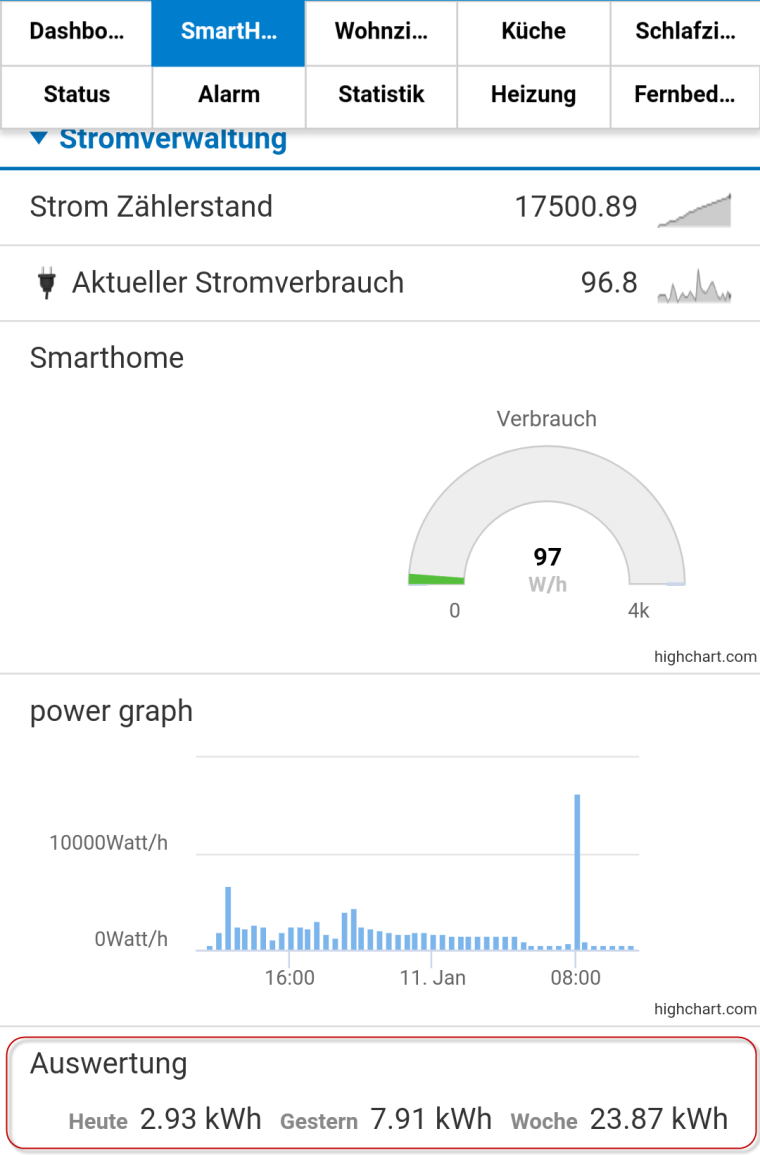
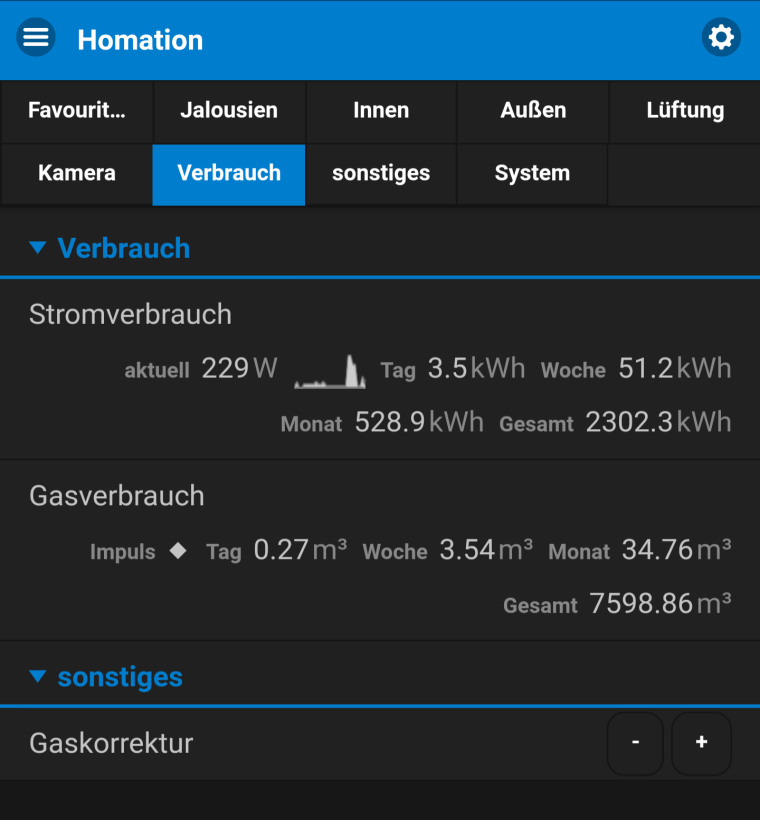
VariableDevice for the GUI with
current consumption = $powermetercounter - $currentcounter
today = $powermetercounter - $daycounter
yesterday = $yesterdaycounter
week = $powermetercounter - $weekcounter
For month, year an total you can make it the same way.
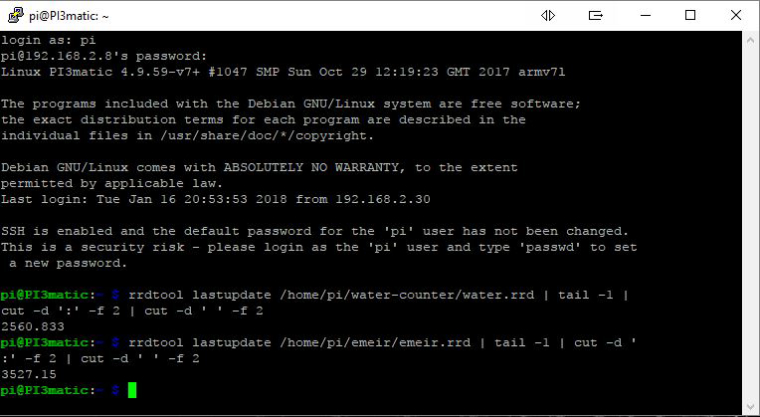
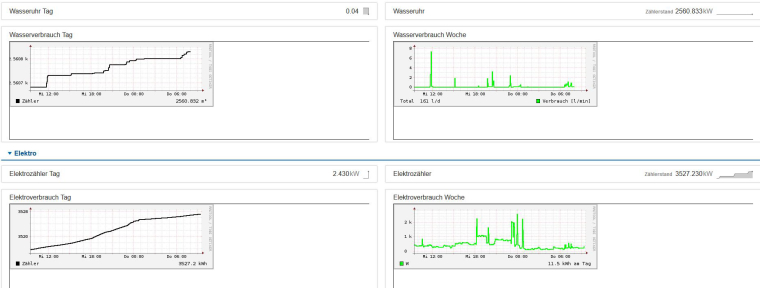
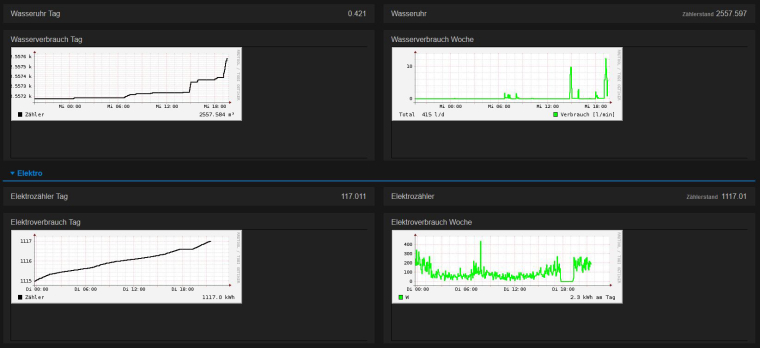
The result is this:
The last device is the variable device.
The charts are generated with the charts-plugin.
The yesterdaycounter variable is also a good candidate for display in a chart,
because it changes once a day.


")
")