Hi,
Since a week or so (or that is when I started to notice it), I have very strange graph behavior for all my temperature measurement, but also some other values whereas the measurements itself are correct.
My pimatic and plugins are all up-to-date.
Edit: I’m running on an RPi3 on Debian Stretch (9) but still with node V4.9.1
In the config I have the following for humidity and temperature:
        {
          "deviceId": "*",
          "attributeName": "temperature",
          "type": "number",
          "expire": "1y"
        },
        {
          "deviceId": "*",
          "attributeName": "humidity",
          "type": "number",
          "expire": "1y"
        },
My general temperature from an esp module for my central heating is measured every 30 seconds and has now over a 100.000 points. (But in the database it says: “5 minutes”??)
esp12-kamer-temperatuur temperature number (continuous) 5min 1y 100912
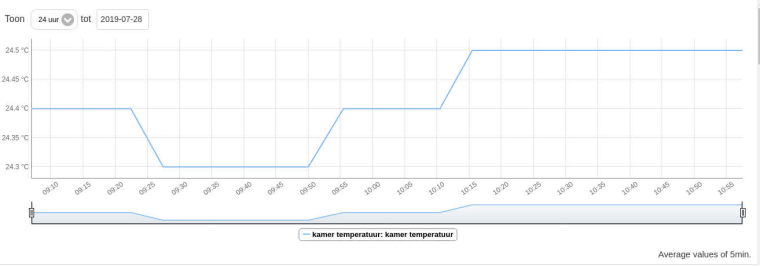
Despite that I get the following graph for 24 hours. The last 2 hours are correct, but where is the rest?

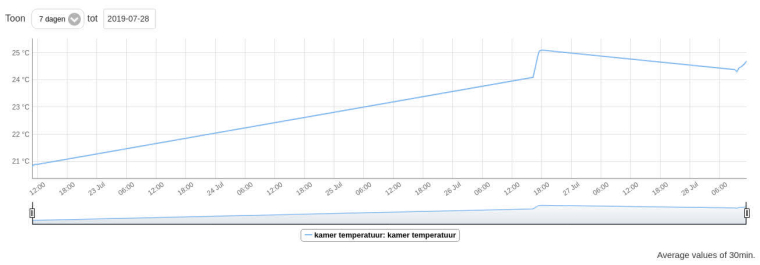
and the following for 7 days:

This is completely ridiculous.
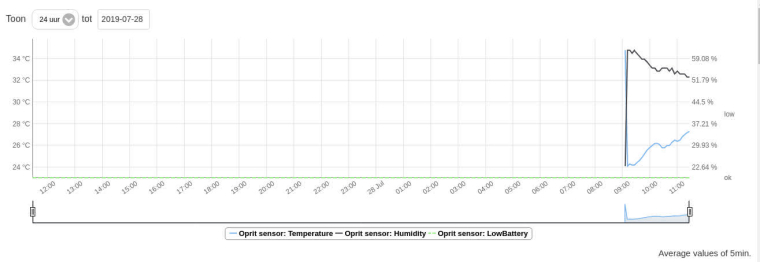
In the 3rd graph you see a external RF sensor with temp, humidty and battery level with the following in the database:
garagebuitensensor	lowBattery	boolean (discrete)	0	7d	7710
garagebuitensensor	temperature	number (continuous)	5min	1y	84676
garagebuitensensor	humidity	number (continuous)	5min	1y	84668
I get this graph for the last 24 hours:

As you can see: battery level functions OK, but temperature and humidity not.
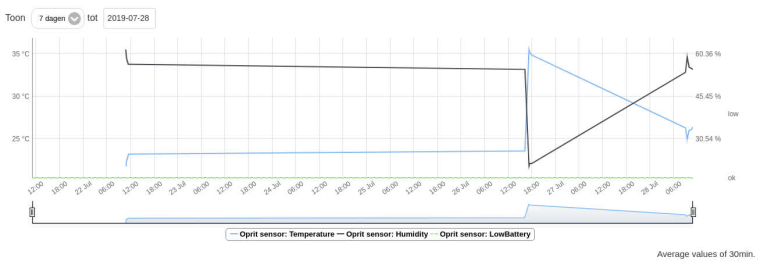
And I get this graph for the last 7 days:

So I stopped pimatic, made a copy of the db (you never know) and within sqlite3 I did:
pragma integrity_check;
VACUUM;
Seemingly nothing is wrong. But obviously something is wrong.
Is this a bug? Am I doing something wrong?
