HI @incmve
all variables displayed in the variable manager are choosable.
-
New Plugin - [pimatic-charts]
-
@kosta
I know whats causing my problems, when I add a variable to the Gaugedevice the name can’t have a space in it.
When it has a space this error comes up and the GUI is all screwed, without the space it works fine.error [pimatic-mobile-frontend]: Client error: Uncaught TypeError: Cannot read property 'series' of undefined 19:41:15error [pimatic-mobile-frontend]: Client error: Unable to process binding "template: function (){return { name:'devicepage-template',foreach:devicepages} }" Message: Unable to process binding "template: function (){return { name:'device-group-template',foreach:$root.groups} }" Message: Unable to process binding "if: function (){return $root.enabledEditing() || $parent.getDevicesInGroup($data.id).length > 0 }" Message: Unable to process binding "if: function (){return !$root.isGroupCollapsed($parent,$data) }" Message: Unable to process binding "template: function (){return { name:$root.getItemTemplate,foreach:$parent.getDevicesInGroup($data.id),afterRender:$parent.afterRenderDevice} }"Follow my domotica project on http://maredana.nl
-
You’re right. For that I have implemented the label option. Name is a pimatic internal identifier.
-
@kosta good work !
Thx a lot for that very nice and useful plugin !!pimatic v0.9 has been released!
Support Pimatic and get some free stickers
Like us on Facebookmake it so !
-
Version 0.0.3 published:
- line colors
- date picker buttons
- bugfix & improvments
The Plugin is still under development and the devices schema is changing.
After an update you get errors about missing or to much properties.Open the devices for edit and save it without changes.
Also open the array properties like variables and save each item again. -
Cool, I only get 1 error after opening and saving the device.
error [pimatic]: Invalid config of device "realtime-power": Property "xAttributeOptions" is not a valid propertyFollow my domotica project on http://maredana.nl
-
I have removed this attribute. The only way to fix that is to remove the property from the config manually.
-
Check, that solved the issue.
Follow my domotica project on http://maredana.nl
-
The Zoom-buttons are not working here.
The most Time they are grey. Sometimes one is black. I´m using 1 hour, 1 day and 1 week.
By the way, what means datagrouping?
Gruß M. -
The ZoomButtons needs data. So the timerange property must be for example “7d”.
Now you can use buttons up to one week.Datagrouping means, that the graph makes a average for each unit.
timerange=7d
button with{ "label": "7day", "count": 7, "unit": "day", "datagrouping": true },=> average value per day for the last 7 days is shown
button with
  {
    "label": "24h",
    "count": 24,
    "unit": "hour",
    "datagrouping": true
  },
=> average value per hour for the last 24h is shown
i’m still writing on github some small wiki pages for better help.
-
Hi,
the example of github have a little error of defination y axis. Pressure 0, Temp 1, humidity 2, speed 3.Good night.
Pimatic, my hobby.
-
Hey, nice plugin.
Is it possible for the future to set varriables for min/max values. This would be nice.Regards daice
-
@daice
a combination with the filter plugin is a good solution.for example:
graph the temperature and get min max per day from the filter plugin and graph it alsoor do you mean something else?
-
Hi @kosta,
is it also possible to implement or to use a bar chart like this
https://www.highcharts.com/demo/column-basic
I’m trying to get some stats into pimatic and this will be a nice thing to do so. Just some ideas are- working time per day (I’m logging this data by tasker, but it is not working as expected by now
 )
) - ventilating time of a day (calculated by door sensor)
- energy consumption (just by a variable input device once a time in some month and divided by the days to the last logged data)
- runtime of a light, tv or whatever…
- many other discontinuous logging data
Thank you so far.
- working time per day (I’m logging this data by tasker, but it is not working as expected by now
-
@Fabian
bar charts are already implemented. chart typ: “column”I have the same requirements for displaying such information,
but I want to leave this plugin as a pure chart plugin.
Of course, the plugin must be able to display these values.Instead I have already thought about a new datalogger or statistic plugin.
I currently use a lot of variables and rules to display historical values
or to calculate certain things.One possibility is to extend the pimatic-filter plugin or to create a new plug-in with focus on data logging at certain times.
Features:
- Count events or calculate the on/off time per time interval and log a value for it.
- Calculate a expression and log this value daily, for example.
- export option
- etc.
-
Hi @kosta ,
ah okay didn’t noticed that the chart type is already implemented. I’ll give it a try over Christmas holidays.
I haven’t expected to implement some kind of calculations into your plugin. These were just ideas to use your chart plugin. The needed statistical calculations have to be done somewhere else. So I’m definitely with you!
Thank you so far!
-
Hey,
thanks for this great plugin!
I´m using it for my photovoltaic system to display the acutal power.
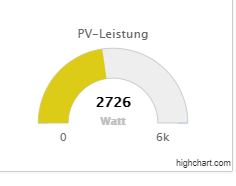
The maximum value of the system is 4900 W. The plugin rounds it up to 6k (6000W).This distorts the view. Anything I can to?
Best regards Patrick
-
There is also another issue. When creating a new ChartDevice, there is an error, that the data need to be grouped. It doesn’t matter whether the datepicker is enabled or not.
The only solution is to add the attribute to all three dates.
08:01:48.378 [pimatic] Invalid config of device "wetter-chart": Missing property "datagrouping" in /datebuttons/0, Missing property "datagrouping" in /datebuttons/1, Missing property "datagrouping" in /datebuttons/2 -
@SaxnPaule thx for the hint. A have already opened a git hub issue for that. A will fix it soon.