Could you please wrap the span.credit to a new line, because it limits the usable space for the chart on smartphones. If the advertisment would be a line below, that would be much better.
In my case I set the display:none property ")
New Plugin - [pimatic-charts]
Could you please wrap the span.credit to a new line, because it limits the usable space for the chart on smartphones. If the advertisment would be a line below, that would be much better.
In my case I set the display:none property
The credit is necessary for license reasons. I’ll check the layout.
Yes I know, because of that I added the
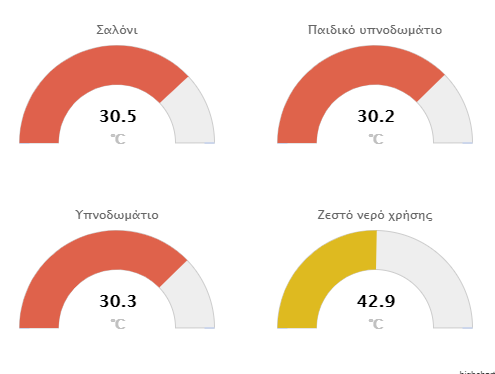
I use gauge to display temperatures and i wanted at least 1 decimal, so i edit line 347 at chart-page.coffee from
((Highcharts.theme && Highcharts.theme.contrastTextColor) || 'black') + '">{y:.0f}</span><br/>' +
to
((Highcharts.theme && Highcharts.theme.contrastTextColor) || 'black') + '">{y:.1f}</span><br/>' +
If you need more just replace 1 to whatever you need {y:.1f}
@Bill-BlackSoll ευχαριστώ
I’m working on a new version with more configuration options.
Perhaps this is interesting as a target to emulate: https://www.youtube.com/watch?v=bB6-vYxi924
@kosta If there are some datapoints missing, the diagram doesn’t continue the line. Is it possible to workaround this issue?
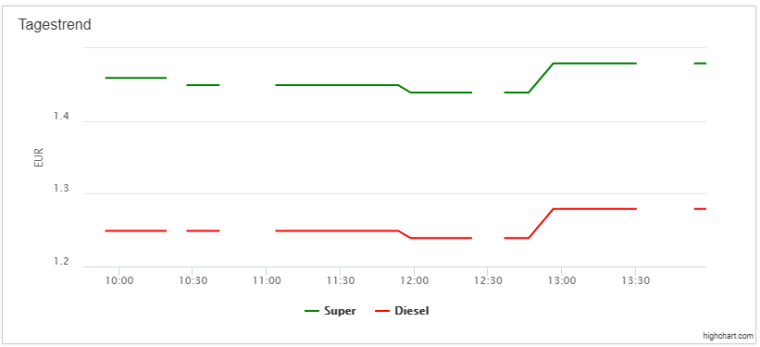
The other question is, why these values are missing. In the pimatic standard graph page they aren’t there as well, but the lines aren’t broken in this case.
@SaxnPaule To me that’s not an issue, it’s a feature.
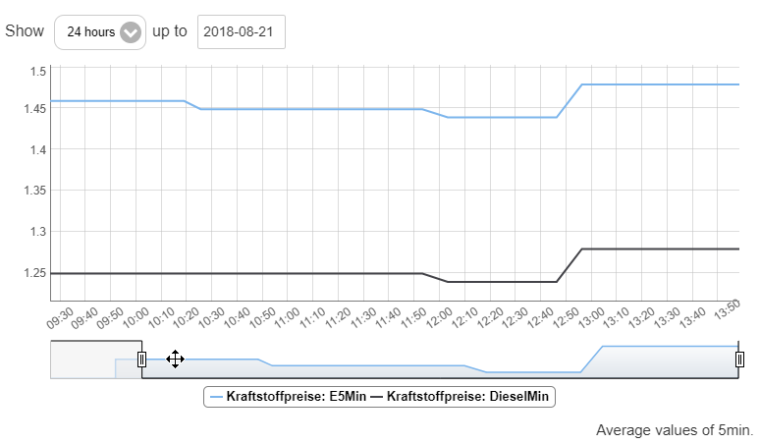
Hi,
I have configured my chart device it shows 1h, 24h and All. 1h works as expected. 24h is always greyed out. Full shows the last 3h. What am I doing wrong. My expectation was to get the last 3 days in “all” mode. Due to the max range of 3h I think the 24h mode gets not activated, am I correct.
Can someone help me to get it running, please?
Here my config:
    {
      "height": 200,
      "timerange": "3d",
      "allowtrace": true,
      "interval": 60,
      "variables": [
        {
          "name": "leistung-gesamt",
          "expression": "round($vzlogger-strom.aktuell, 0)",
          "type": "number",
          "chart": "area",
          "dashstyle": "Solid",
          "color": "orange"
        }
      ],
      "yaxis": [
        {
          "label": "Leistung",
          "unit": "W"
        }
      ],
      "showdatepicker": true,
      "datebuttons": [
        {
          "label": "1h",
          "count": 1,
          "unit": "hour",
          "datagrouping": false
        },
        {
          "label": "24h",
          "count": 1,
          "unit": "day",
          "datagrouping": false
        },
        {
          "label": "Voll",
          "count": 0,
          "unit": "all",
          "datagrouping": false
        }
      ],
      "id": "haus-gesamt",
      "name": "Haus (gesamt)",
      "class": "ChartDevice"
    },
@SaxnPaule @mr_smith
Both are right.
It should be configurable. I will check this.
@OrTiN
How old is the chart devices? The chart device must be as old as you want to display data.
But I will try to reproduce it.
The device is part of the config since month!
I installed Charts on a fresh Pimatic installation. The time axis is a bit weird:
The system is running for hours now, but it shows times from 01:00:00.000 to 01:00:00.075, the trace labels showing the wrong timestamp. The Data seams to be ok. The 1min and 1day buttons are greyed out.
I’m running Pimatic with a MariaDB database.