For those who are using a Synology NAS and would like some info about their NAS on the Pimatic UI.
Save the script below as a shell ( .sh) script on your NAS, edit it to your needs (adjust the number of HDD’s and your Pimatic user login) and call it periodically from the DSM task manager.
Make sure you have the variables in place in Pimatic!
#!/bin/sh
UPTIME1=$(uptime | grep -ohe 'load average[s:][: ].*' | awk '{ print $4+0 }') # The '+0' makes the AWK column 4 defined as NUMBER
TEMP1=$(smartctl -d sat -A /dev/sg0 | grep -i Temperature_Celsius | tr -s ' ' | cut -d\  -f 10) #Disk 1 temp to variabele
TEMP2=$(smartctl -d sat -A /dev/sg1 | grep -i Temperature_Celsius | tr -s ' ' | cut -d\  -f 10) #Disk 2 temp to variabele
TEMP3=$(smartctl -d sat -A /dev/sg2 | grep -i Temperature_Celsius | tr -s ' ' | cut -d\  -f 10) #Disk 3 temp to variabele
#TEMP4=$(smartctl -d sat -A /dev/sg3 | grep -i Temperature_Celsius | tr -s ' ' | cut -d\  -f 10) #Disk 4 to naar variabele
DISKUSAGE=$(df | tr -s ' ' $'\t' | grep volume_1 | cut -f5)
curl --user USER:PASSWORD -X PATCH "https://YOURPIMATICIP/api/variables/Nas_Disk1_Temp?type=value&valueOrExpression=$TEMP1"
curl --user USER:PASSWORD -X PATCH "https://YOURPIMATICIP/api/variables/Nas_Disk2_Temp?type=value&valueOrExpression=$TEMP2"
curl --user USER:PASSWORD -X PATCH "https://YOURPIMATICIP/api/variables/Nas_Disk3_Temp?type=value&valueOrExpression=$TEMP3"
curl --user USER:PASSWORD -X PATCH "https://YOURPIMATICIP/api/variables/Nas_Load_5Min?type=value&valueOrExpression=$UPTIME1"
curl --user USER:PASSWORD -X PATCH "https://YOURPIMATICIP/api/variables/Nas_Disk_Usage?type=value&valueOrExpression=$DISKUSAGE"
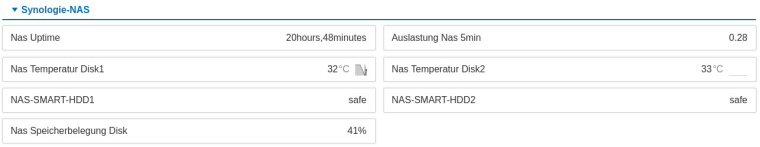
Here’s a pic of the GUI

ps) i use this on a DS411j, really don’t know if it will work on all models…but would be a nice starting point ")
PSPS) Some documentation about the CPU load, important because a load of 1 would mean, in my case, somethings are heating up!
IMPORTANT!

")