Hey,
it took some time to setup pimaticon my raspberry, but now i have the first d18b20 sensor working fine!
(Sorry for my bad english ") )
)
I want to use it with 8 more sensors to monitor and optimze my heating.
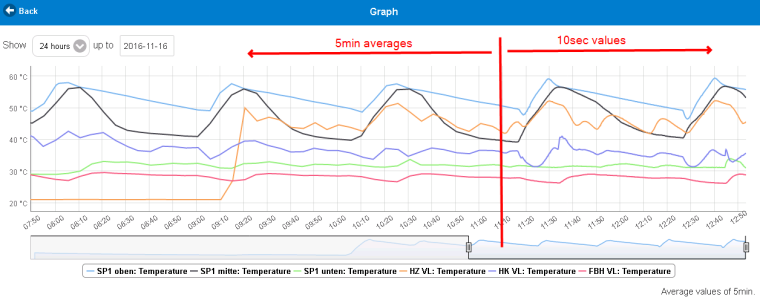
Therfore the graph-funkction is very useful.
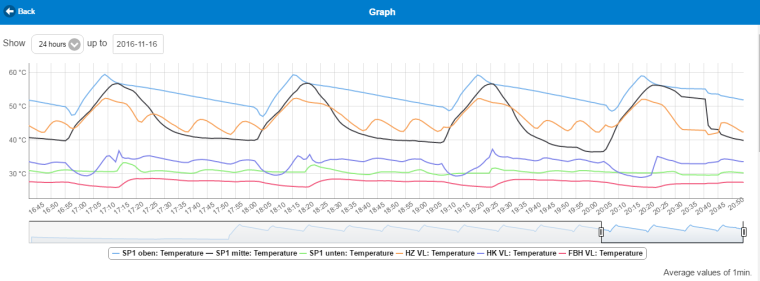
But there is one problem: In the graph pimatic shows the Average values of 5min. A heating-intervall has a duration of ~30 min. So I need to see the graph in more detailed values: Average values of 1min.
Any help for me?!?
Thanks
Limbi