sorry for being a grave digger just in my first posting here. But this is exactly what i’m looking for…
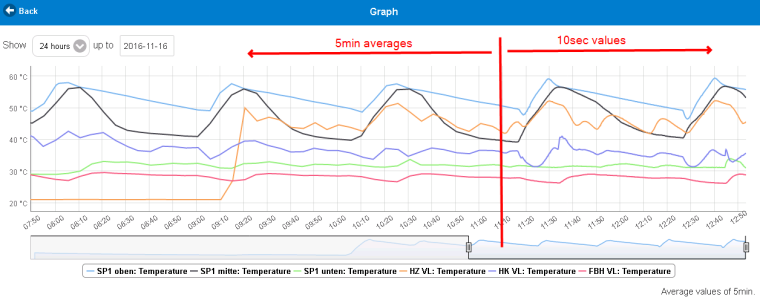
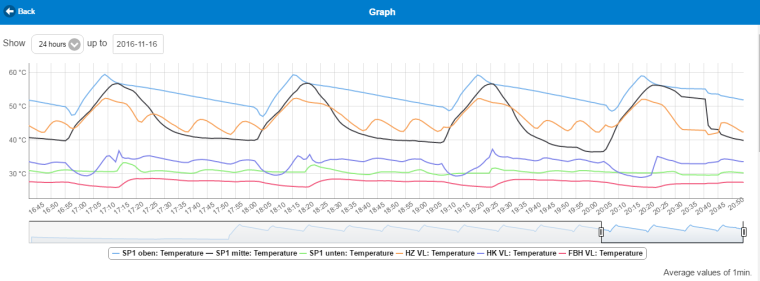
When opening the GRAPH it gives me 5min average-values. When looking live at the graph then the received values are painted every 10 secs.
You can see that the graph is much more informative with more data
Would be great to have an option to change the “5min averages” to a lower value.
I would also appreciate a hint where inside the code this is set (hard coded) - so it might be an option to directly update the source-code.
Any hints ?
Ove

")